Silvers, Levi G., and Stansfield, Alyssa M. and Reed, Kevin A., : The Impact of Rotation on Tropical Climate, the Hydrologic Cycle, and Climate Sensitivity. Geophysical Research Letters, 51, e2023GL105850 , https://doi.org/10.1029/2023GL105850
Key Points
Plain Language Summary
Many useful studies of the tropical regions of Earth have neglected to include rotation; however, phenomena such as tropical cyclones and atmospheric waves are fundamentally tied to rotation. This work compares models of the tropics with and without rotation. Compared to experiments without rotation, rotating experiments have a more humid and stable atmosphere. Although water vapor is cycled through the atmosphere at a slower rate, the precipitation rate increases. The climate sensitivity also increases due to changes in both clouds and water vapor. Many of these changes are the result of increased wind speeds. We argue that idealized modeling of Earth's tropical regions should include not just stationary experiments but also experiments that include rotation.
Abstract
This work explores the impact of rotation on tropical convection and climate. As our starting point, we use the RCEMIP experiments as control simulations and run additional simulations with rotation. Compared to radiative convective equilibrium (RCE) experiments, rotating RCE (RRCE) experiments have a more stable and humid atmosphere with higher precipitation rates. The intensity of the overturning circulation decreases, water vapor is cycled through the troposphere at a slower rate, the subsidence fraction decreases, and the climate sensitivity increases. Several of these changes can be attributed to an increased flux of latent and sensible heat that results from an increase of near‐surface wind speed with rotation shortly after model initialization. The increased climate sensitivity results from changes of both the longwave cloud radiative effect and the longwave clear‐sky radiative fluxes. This work demonstrates the sensitivity of atmospheric humidity and surface fluxes of moisture and temperature to rotation.
Key Figure
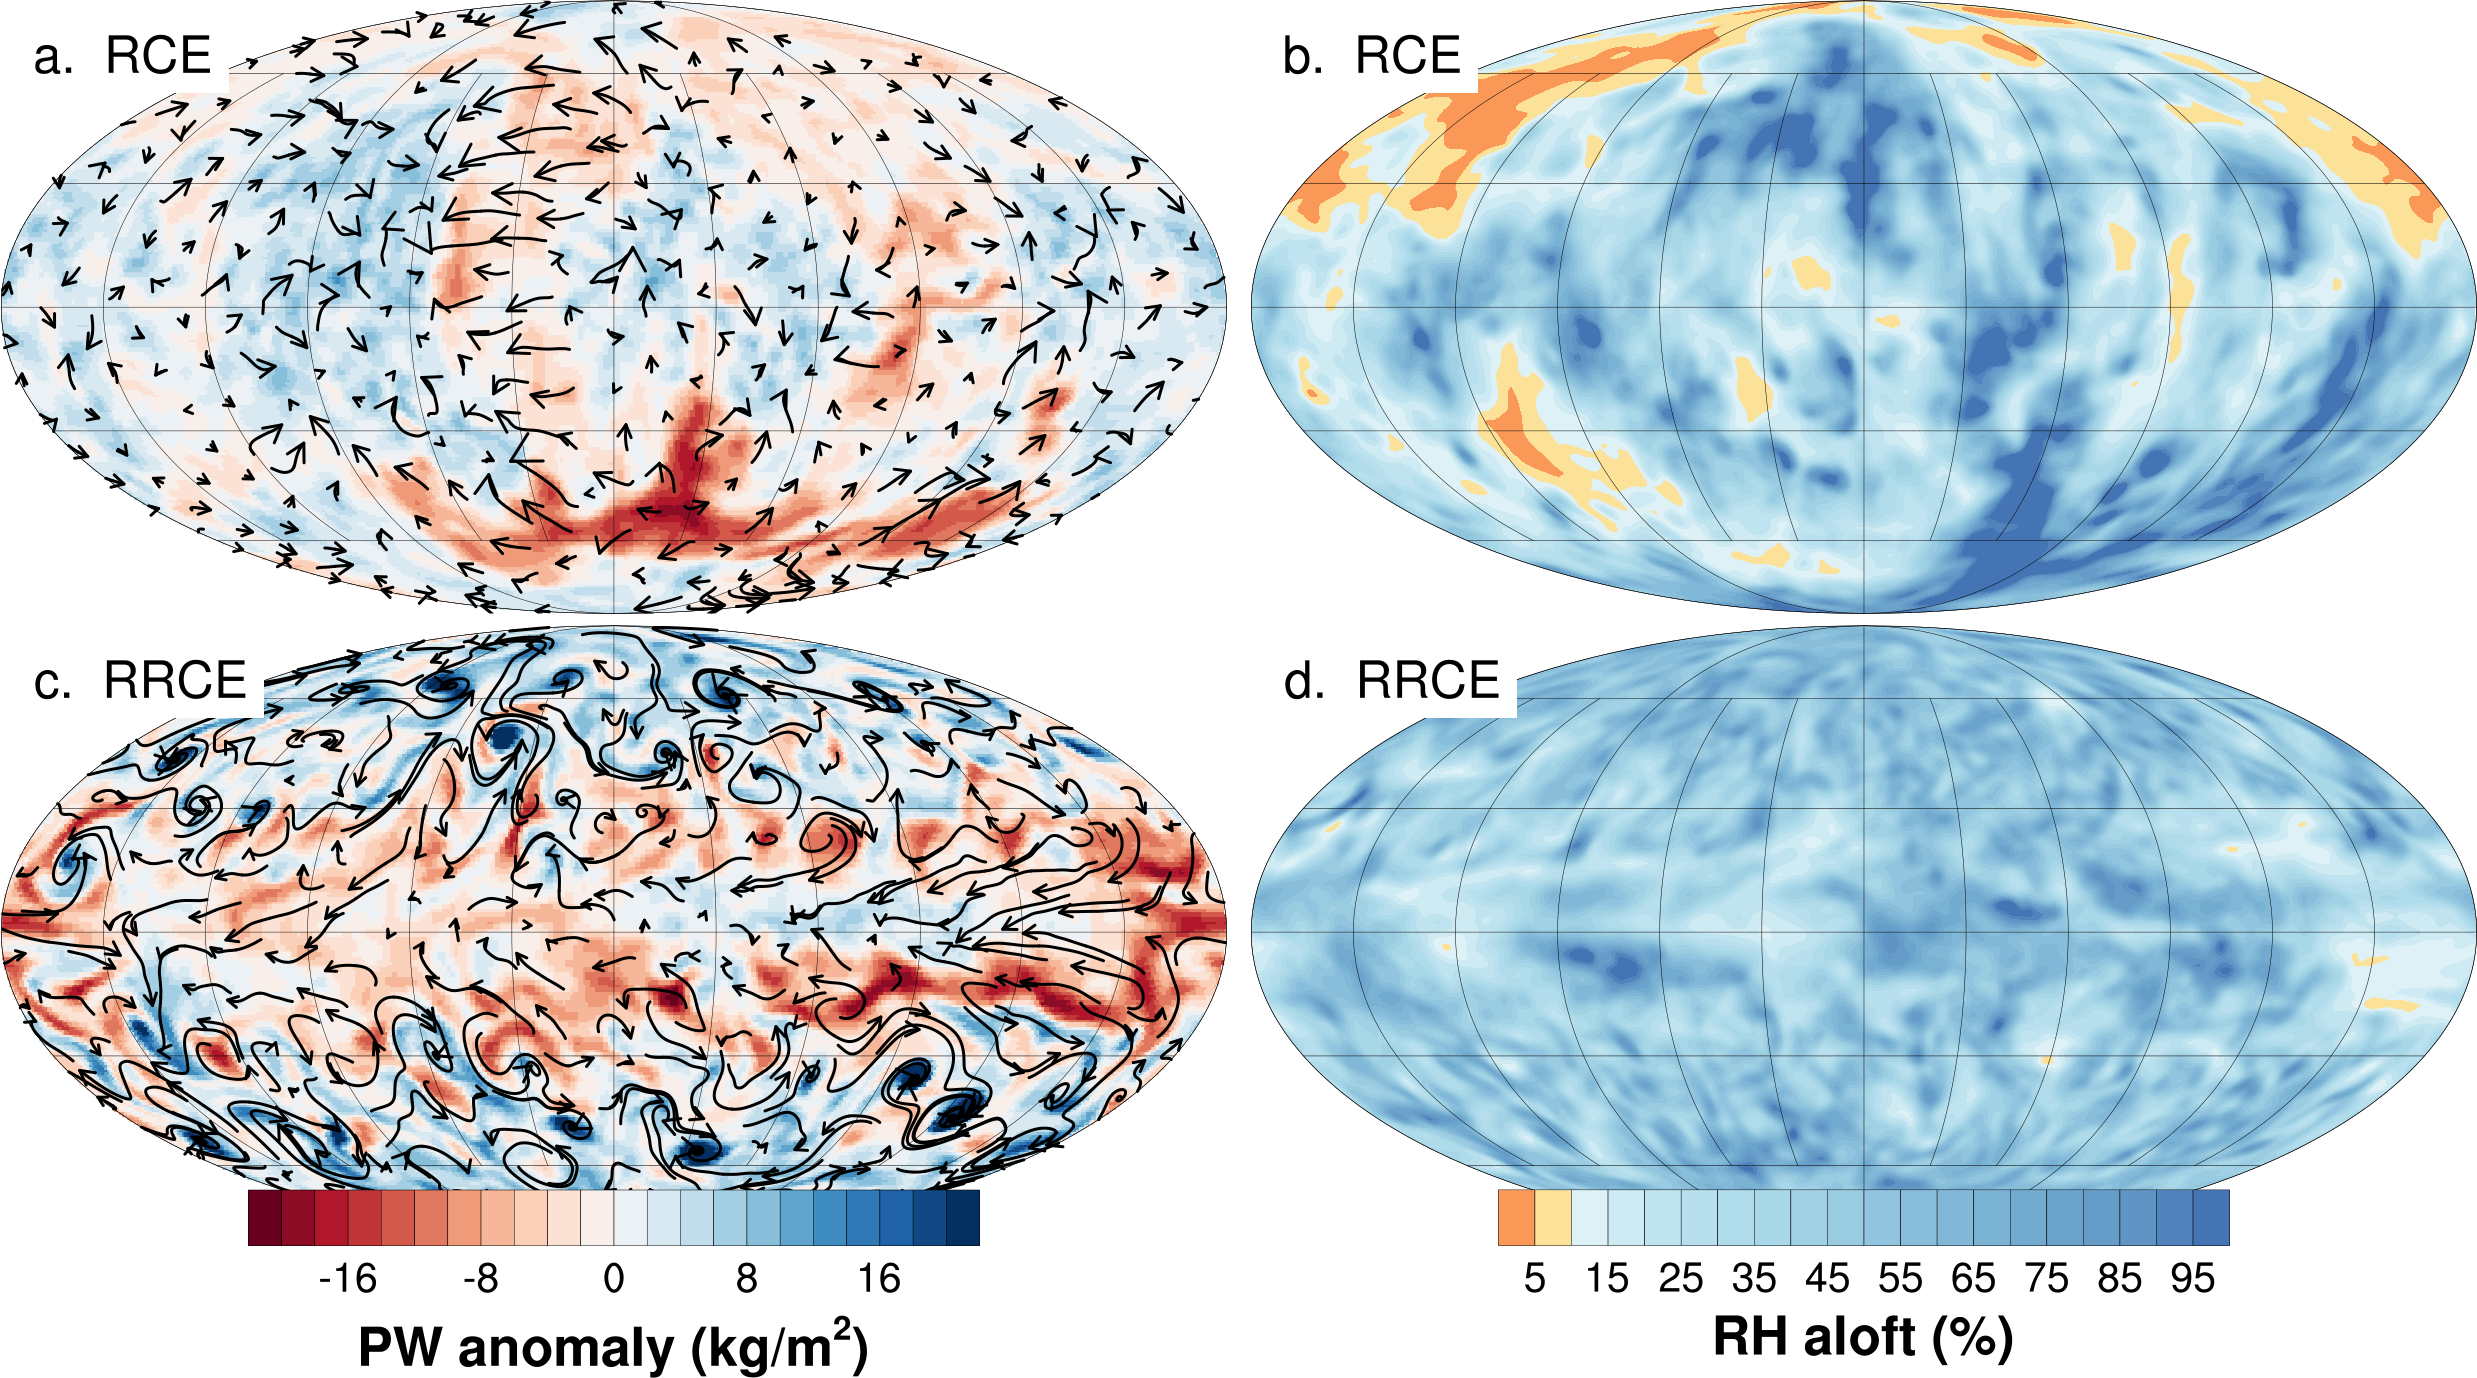
ComparisonbetweenRCE(top)andRRCE(bottom)simulations.Ontheleftisshownanhourlyaveragedsnapshotoftheprecipitablewater(PW)anomalyand the wind vectors on the lowest model level. On the right is shown the RH on the 445 hPa pressure level, averaged over 1 week. Data is from the simulation with a constant SST of 300K at the end of the 2nd year of simulation using the CAM6 model.
Acknowledgments
Reed and Silvers acknowledge support from NSF award numbers 1830729 and 2327958. Stansfield acknowledges support from NSF award number 2204138. We are grateful for the comments of an anonymous reviewer and a review by Timothy W. Cronin which helped to improve the manuscript. This material is based upon work supported by the National Center for Atmospheric Research, which is sponsored by the National Science Foundation under Cooperative Agreement No. 1852977. We acknowledge high‐performance computing support from Cheyenne (https://doi.org/10.5065/D6RX99HX) provided by NCAR's Computational and Information Systems Laboratory, sponsored by the National Science Foundation.