Song, J., Y. Duan, and P. J. Klotzbach, : Revisiting the relationship between tropical cyclone size and intensity over the western North Pacific. Geophysical Research Letters, 47, e2020GL088217 , https://doi.org/10.1029/2020GL088217
Key Points
Plain Language Summary
Tropical cyclone (TC) size and intensity are two primary metrics determining the destructive potential of a TC. Previous studies have reported a nonlinear size‐intensity relationship, in which TC size substantially increases with intensity to an upper bound and then remains constant or even decreases with increasing intensity. Using best tracks from the Japan Meteorological Agency (JMA) for 2007‐2019, we find that this statistical nonlinear size‐intensity relationship only occurs for TCs with stronger lifetime maximum intensities (e.g. typhoons). Whether the size‐intensity relationship is linear or nonlinear is jointly determined by the track that the TC takes and its evolution type on a size‐intensity diagram. There is a linear size‐intensity relationship for recurving typhoons reaching their peak intensities and sizes simultaneously and for typhoons that are relatively straight‐moving. For other recurving typhoons, the nonlinear size‐intensity relationship is primarily caused by a nonlinear size decrease during the weakening stage. We speculate that, as recurving typhoons move poleward, weakening TCs often begin to shrink, while the interaction between the TC and the midlatitude circulation leads to a baroclinic expansion of TC size. Finally, different evolution types for WNP typhoons can be determined by the ratio of intensity/size to its theoretical maximum.
Abstract
This study revisits the nonlinear relationship between tropical cyclone (TC) size and intensity over the western North Pacific (WNP). Using best track data from the Japan Meteorological Agency from 2007‐2019, we find that the statistical turning point on a fitted size‐intensity curve only exists for TCs with greater lifetime peak intensities (e.g. typhoons). The track and evolution type are two factors determining the statistical size‐intensity relationship. The nonlinear size‐intensity relationship is only observed for recurving typhoons reaching their peak intensities and sizes at different times, due to a non‐monotonic size change during the weakening stage. The slight size decrease in the initial weakening stage can be linked to a TC weakening‐induced shrinkage balanced by a baroclinic expansion when recurving typhoons move into higher latitudes. Finally, different evolution types for WNP typhoons can be determined by the ratio of intensity/size to its theoretical maximum.
Key Figure
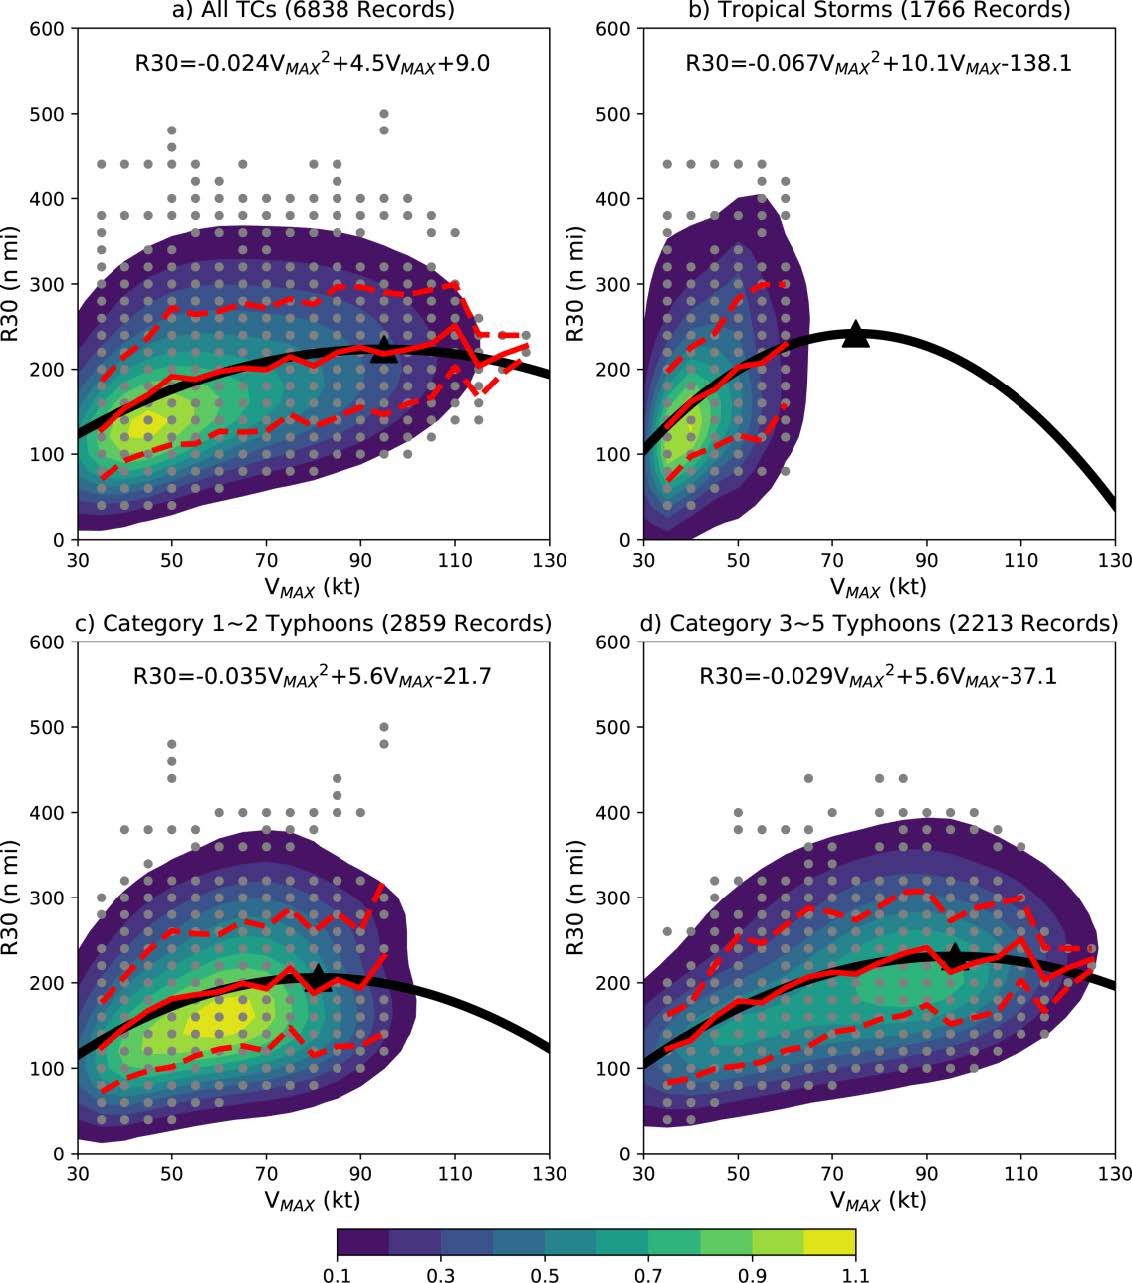
Fig. 1. (a) Relationship between TC size (R30) and intensity (VMAX) for (a) all TCs, (b) tropical storms (34 kt≤LMI<64 kt), (c) category 1-2 typhoons (64 kt≤LMI<96 kt) and (d) category 3- 5 typhoons (LMI≥96 kt) during 2007-2019. Solid black lines represent the best-fit quadratic curves that are all significant at the 0.01 level based on an F-test, with their maximum indicated by triangles. Red lines denote the mean (solid) and the standard deviation (dashed) of R30. Filling contours refer to the probability density through a Gaussian kernel density estimation.
Acknowledgments
We would like to express our sincere thanks to four anonymous reviewers for their helpful comments on an earlier version of this manuscript. This work was jointly funded by the National Natural Science Foundation of China (61827901), the National Key Research and Development Program of China (2018YFC1507305) and the National Natural Science Foundation of China (41575044). Klotzbach would like to acknowledge financial support from the G. Unger Vetlesen Foundation.