Song, J., P. J. Klotzbach, and Y. Duan, : Increasing trend in rapid intensification magnitude of tropical cyclones over the western North Pacific. Environmental Research Letters, 15, 084043 , https://doi.org/10.1088/1748-9326/ab9140
Key Points
Plain Language Summary
Abstract
Rapid intensification (RI) refers to a significant increase in tropical cyclone (TC) intensity over a short period of time. A TC can also undergo multiple RI events during its lifetime, and these RI events pose a significant challenge for operational forecasting. The long-term tendency in RI magnitude of TCs over the western North Pacific is investigated in this study. During 1979-2018, a significant increasing trend is found in RI magnitude, which primarily results from the significant increasing number of strong RI events, defined as 24-h intensity increases of at least 50 kt. Furthermore, there are significantly more (slightly fewer) strong RI occurrences west (east) of 155°E in 1999-2018 than in 1979-1998. Significant increases in strong RI occurrences are located over the region bounded by 10°~20°N, 120°~150°E. These changes are likely induced by the warming ocean but appear uncorrelated with changes in the atmospheric environment. By contrast, there are slight decreases in strong RI occurrences over the region bounded by 12.5°~22.5°N, 155°~170°E, likely due to the offset between RI-favorable influences of the warming ocean and RI-unfavorable influences of increasing vertical wind shear (VWS).
Key Figure
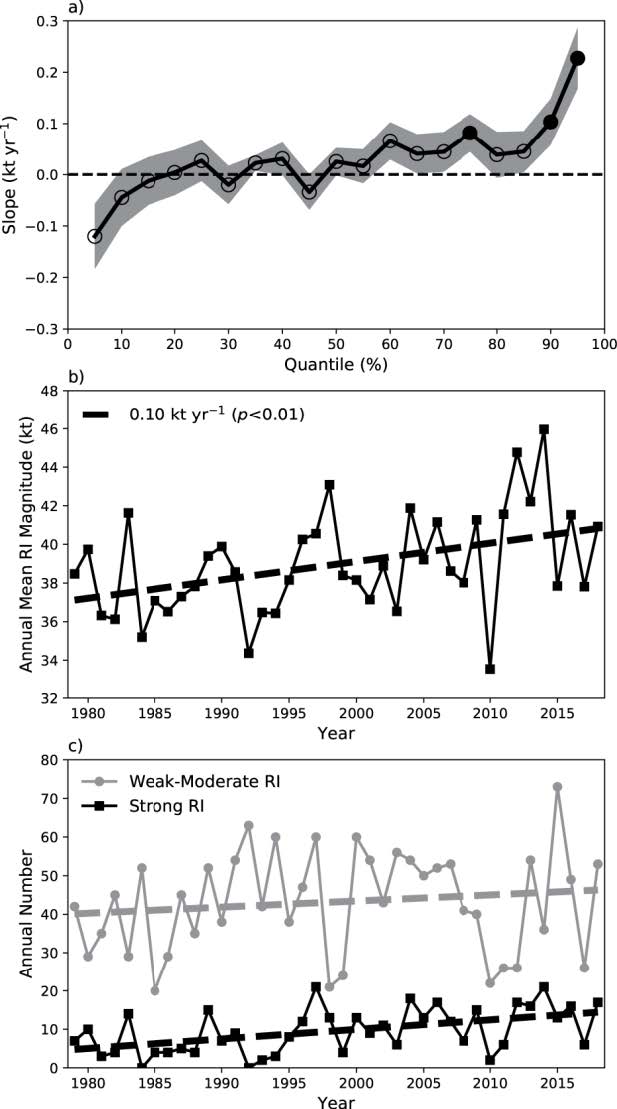
Fig. 2. (a) Slope of the quantiles for 24-h intensity changes (ΔV24s) for all TCs over the WNP from 1979-2018. Circles represent the slope derived by the least squares of ΔV24 as a function of year for each quantile from 5% to 95% in 5% intervals. Filled circles indicate that the slope is significant at the 0.05 level. Shading denotes the standard error of the estimated slope, representing the average distance that the original values fall from the regression line. (b) Annual averages for RI magnitude of WNP TCs from 1979 to 2018. The dashed line shows the long-term linear trend obtained by least squares. (c) Annual numbers of 24-h WNP RI events in weak-moderate (< 50 kt) and strong RI (≥50 kt) categories during 1979-2018. Gray and black lines denote the numbers of weak-moderate RI events and strong RI events, respectively. Dashed lines indicate linear trends derived from least squares.
Acknowledgments
We would like to express our sincere thanks to three anonymous reviewers for their helpful comments on an earlier manuscript. This work was jointly funded by the National Nature Science Foundation of China (61827901) and the National Key Research and Development Program of China (2018YFC1507305). Klotzbach would like to acknowledge financial support from the G. Unger Vetlesen Foundation.