Saunders, M. A., P. J. Klotzbach, A. S. R. Lea, C. J. Schreck, M. M. Bell, : Quantifying the Probability and Causes of the Surprisingly Active 2018 North Atlantic hurricane season. Earth and Space Science, 7, e2019EA000852 , https://doi.org/10.1029/2019EA000852
Key Points
Plain Language Summary
Seasonal outlooks for North Atlantic hurricane activity contribute to the anticipation of risk for insurance companies, other weather-sensitive businesses, and local and national governments. However, the uncertainty associated with such forecasts is often unclear. This reduces their benefit and contributes to the perception of forecast “busts.” The issue is highlighted by the destructive and surprising 25% above-average 2018 Atlantic hurricane season. Retrospective examination of the key August–September 2018 environmental fields that explain ~50% of long‐term Atlantic hurricane activity shows that all were consistent with a well below‐average 2018 hurricane season. A below‐normal season was also anticipated by hurricane outlooks issued in early August 2018. The large mismatch between the observed and replicated levels of hurricane activity in 2018 is an extreme example of the uncertainty inherent in hurricane outlooks. We show that this uncertainty may be properly clarified by expressing outlooks in terms of probability of exceedance. The likelihood that the observed 2018 hurricane activity would occur with retrospective knowledge of the key environmental fields is about 5%. Hyperactive storm activity in the subtropical North Atlantic contributed to the surprisingly active 2018 hurricane season. The unusual subtropical activity was not anticipated because statistical models lack skill in anticipating such activity.
Abstract
The 2018 North Atlantic hurricane season was a destructive season with hurricanes Florence and Michael causing significant damage in the southeastern United States. In keeping with most destructive hurricane seasons, basinwide tropical cyclone activity was above average in 2018?by ~25% for named storm numbers, hurricane numbers, and Accumulated Cyclone Energy (ACE). In contrast to this above-normal activity, the August?September tropical environmental fields that explain ~50% of the variance in Atlantic basin hurricane activity between 1950 and 2017 anticipated a well below-average 2018 hurricane season. The surprisingly large mismatch between the observed and replicated levels of hurricane activity in 2018 is an extreme example of the uncertainty inherent in seasonal hurricane outlooks and highlights the need for these outlooks to be issued in terms of probability of exceedance. Such probabilistic information would better clarify the uncertainty associated with hurricane outlooks to the benefit of users. With retrospective knowledge of the August?September 2018 key tropical environmental fields, the chance that the observed 2018 Atlantic hurricane activity would occur is about 5%. The reasons for the surprisingly high hurricane activity in 2018 are a hurricane outbreak in early September and, in particular, the occurrence of unusually high tropical cyclone activity in the subtropical North Atlantic. The hyperactive subtropical activity was not anticipated because contemporary statistical models of seasonal Atlantic hurricane activity lack skill in anticipating subtropical ACE compared to tropical ACE.
Key Figure
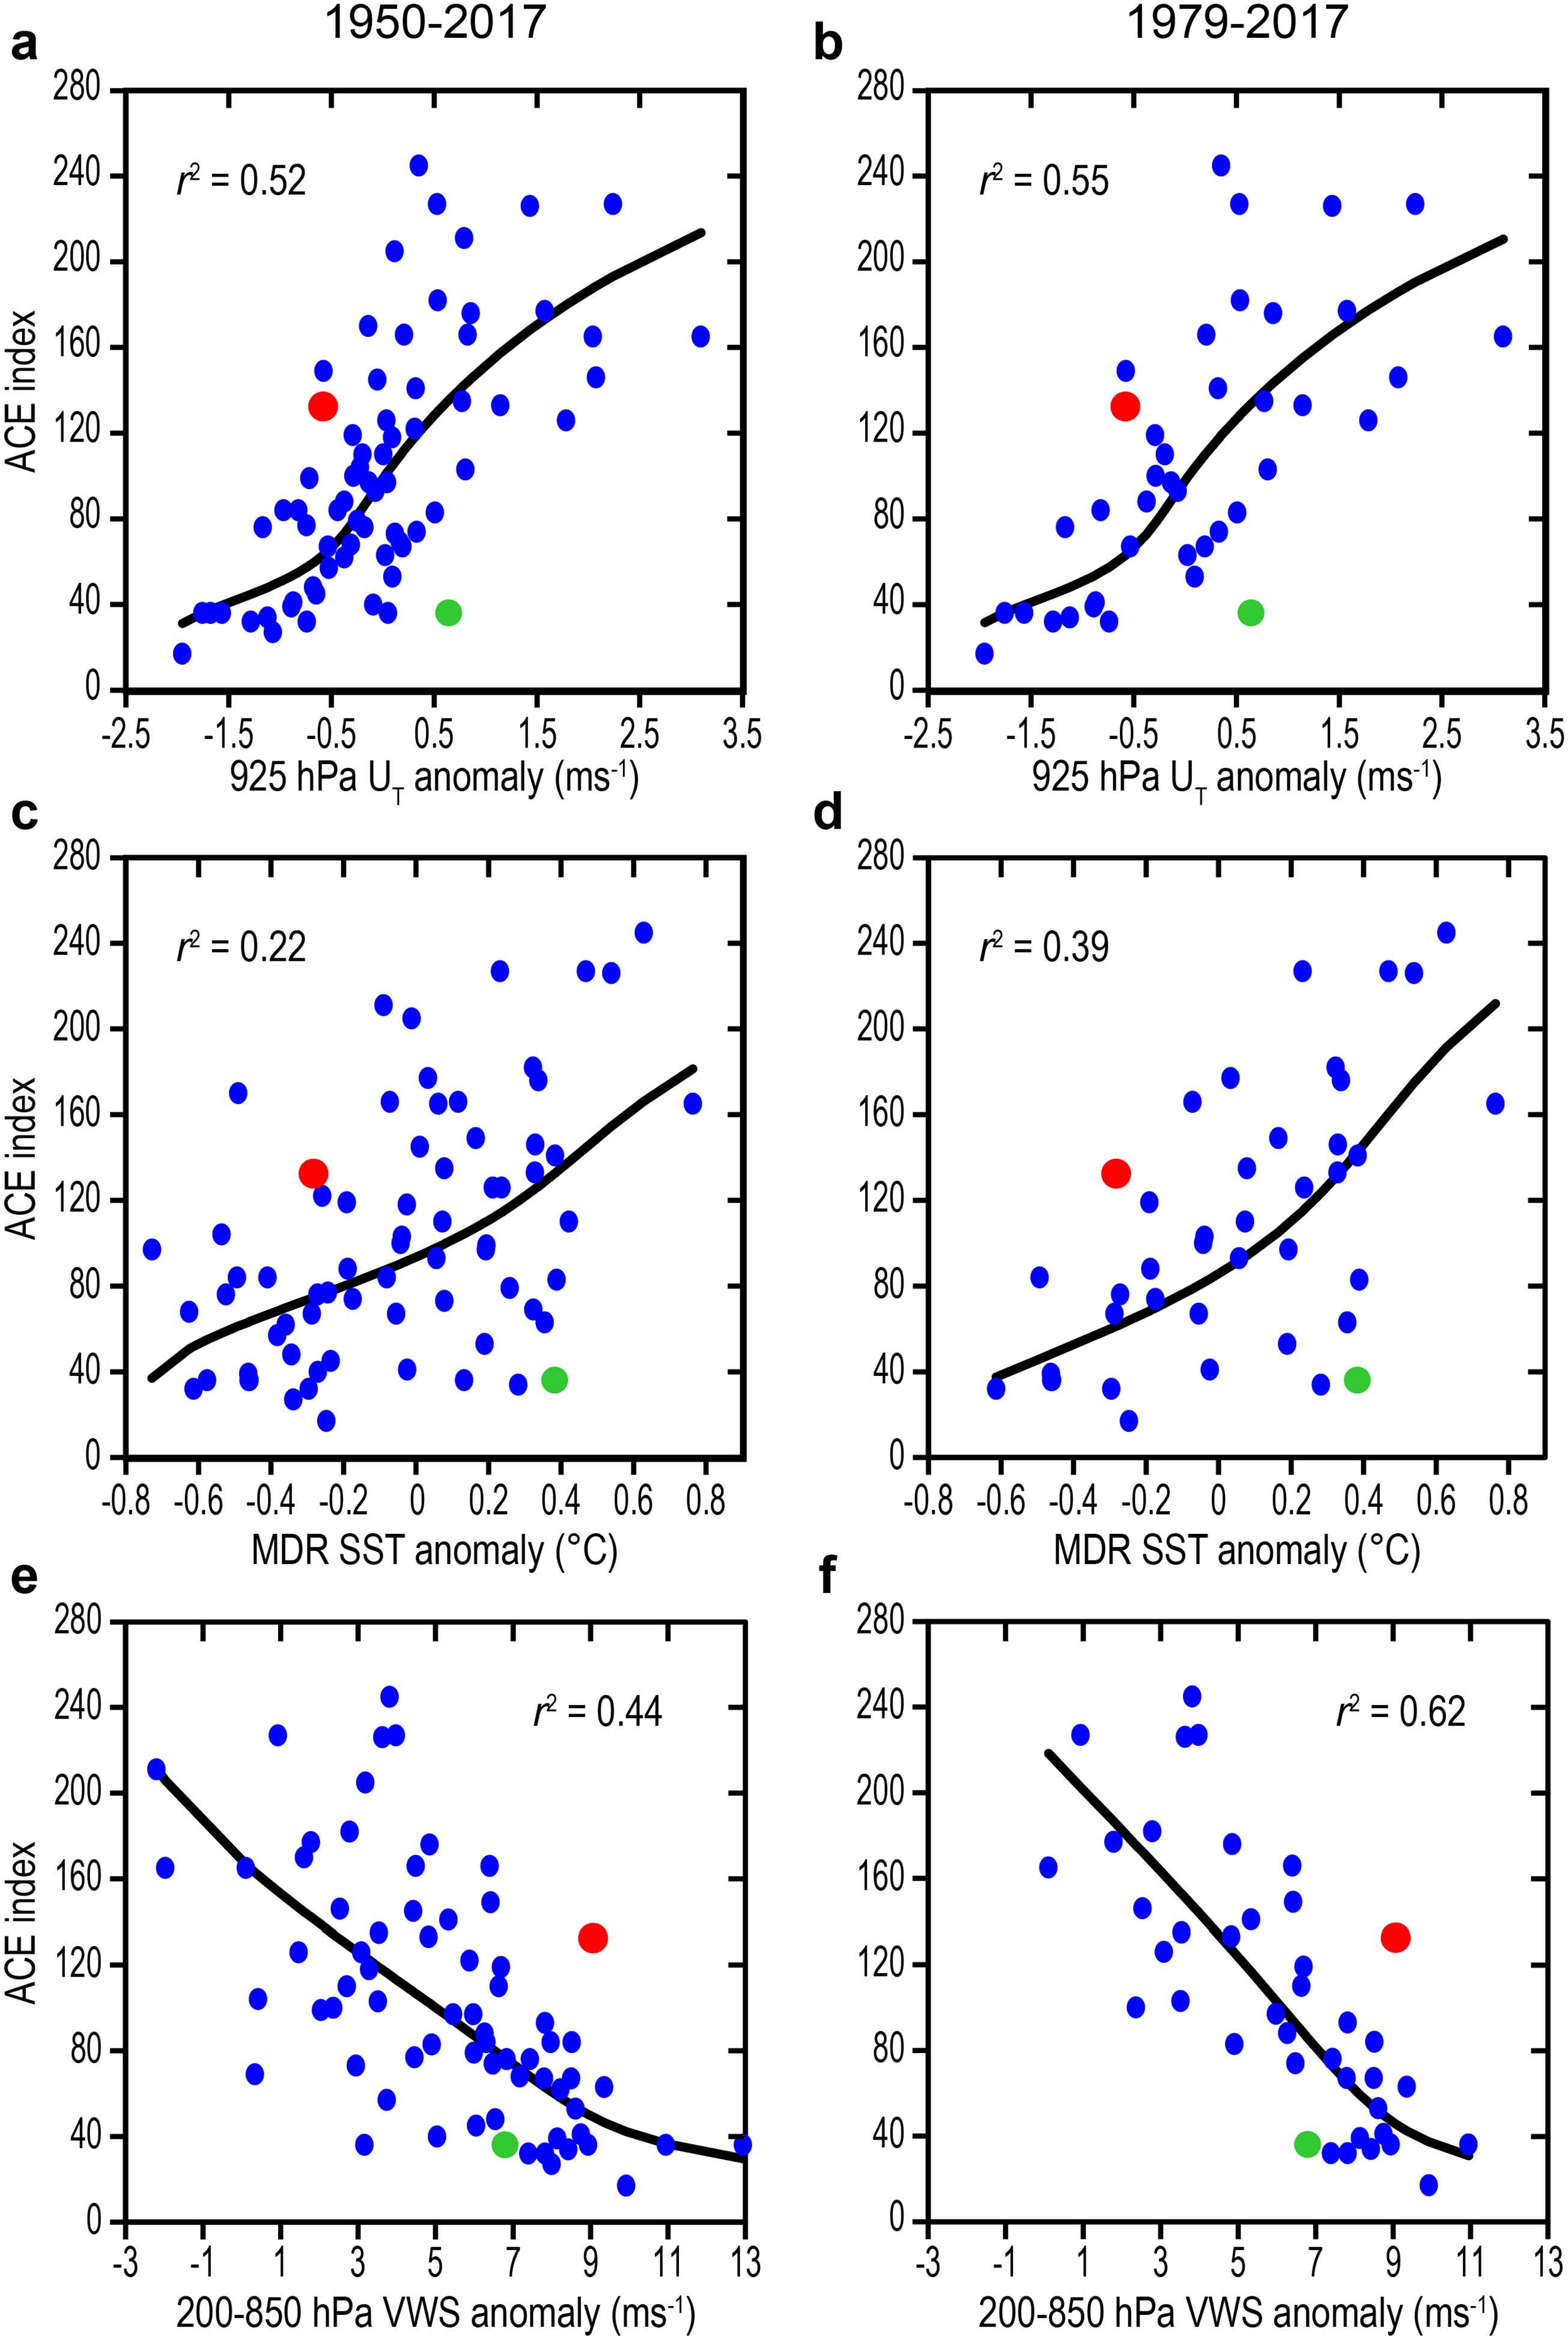
FIG. 3. Scatter plots showing the nature and the strength of the links between three key environmental fields in Table 1 and ACE (×104 kt2). These links are displayed for 1950–2017 data (left column) and for 1979–2017 data (right column). The environmental fields are (a and b) August–September 925 hPa uT, (c and d) August–September MDR SST, and (e and f) August–September 200–850 hPa zonal VWS. Each panel shows the best fit linear regression line (computed by transforming ACE and each environmental field to normal distributions and then transforming back) and the percentage of the ACE variance that this line explains (r2). Red circles denote the 2018 values. Green circles denote the 2013 values (mentioned in section 6.1).
Acknowledgments
We thank Ryan Truchelut and two anonymous reviewers for their thorough reading of the manuscript and for helpful comments and suggestions. P. J. Klotzbach acknowledges support from the Office of Naval Research (Award N000141613033) and from the G. Unger Vetlesen Foundation. C. J. Schreck acknowledges support from NOAA through the Cooperative Institute for Climate and Satellites‐North Carolina (Cooperative Agreement NA14NES432003). M. M. Bell acknowledges support from the Office of Naval Research (Award N000141613033). The authors declare that they have no financial conflicts of interest.