DeHart, J. C., M. M. Bell, : A Comparison of the Polarimetric Radar Characteristics of Heavy Rainfall from Hurricanes Harvey (2017) and Florence (2018). Journal of Geophysical Research - Atmospheres, 125, e2019JD032212 , https://doi.org/10.1029/2019JD032212
Key Points
Abstract
Polarimetric coastal radar data are used to compare the rainfall characteristics of Hurricanes Harvey (2017) and Florence (2018). Intense rainfall was an infrequent yet important contributor to the total rainfall in Harvey, but its relative contribution varied spatially. The total rainfall over land maximized near the coast over Beaumont, TX due to intense convection resulting from prolonged onshore flow downshear from the circulation center. Overall, polarimetric radar observations in Harvey show a dominance of high concentrations of small-to-medium drops, consistent with prior tropical cyclone studies. The microphysical characteristics were spatially and temporally inhomogeneous however, with larger drops more frequent on 27 August and higher number concentrations more frequent on 28 and 30 August. The polarimetric variables and raindrop characteristics observed during Florence share broad similarities to Harvey, but had reduced variability, fewer observations of stronger reflectivity and differential reflectivity, and a lower frequency of high number concentrations and medium-sized drops. The radar data indicate Florence had reduced coverage of stronger convection compared to Harvey. We hypothesize that differences in storm motion, intensity decay rates, and vertical wind shear produce the distinct precipitation structures and microphysical differences seen in Harvey and Florence.
Key Figure
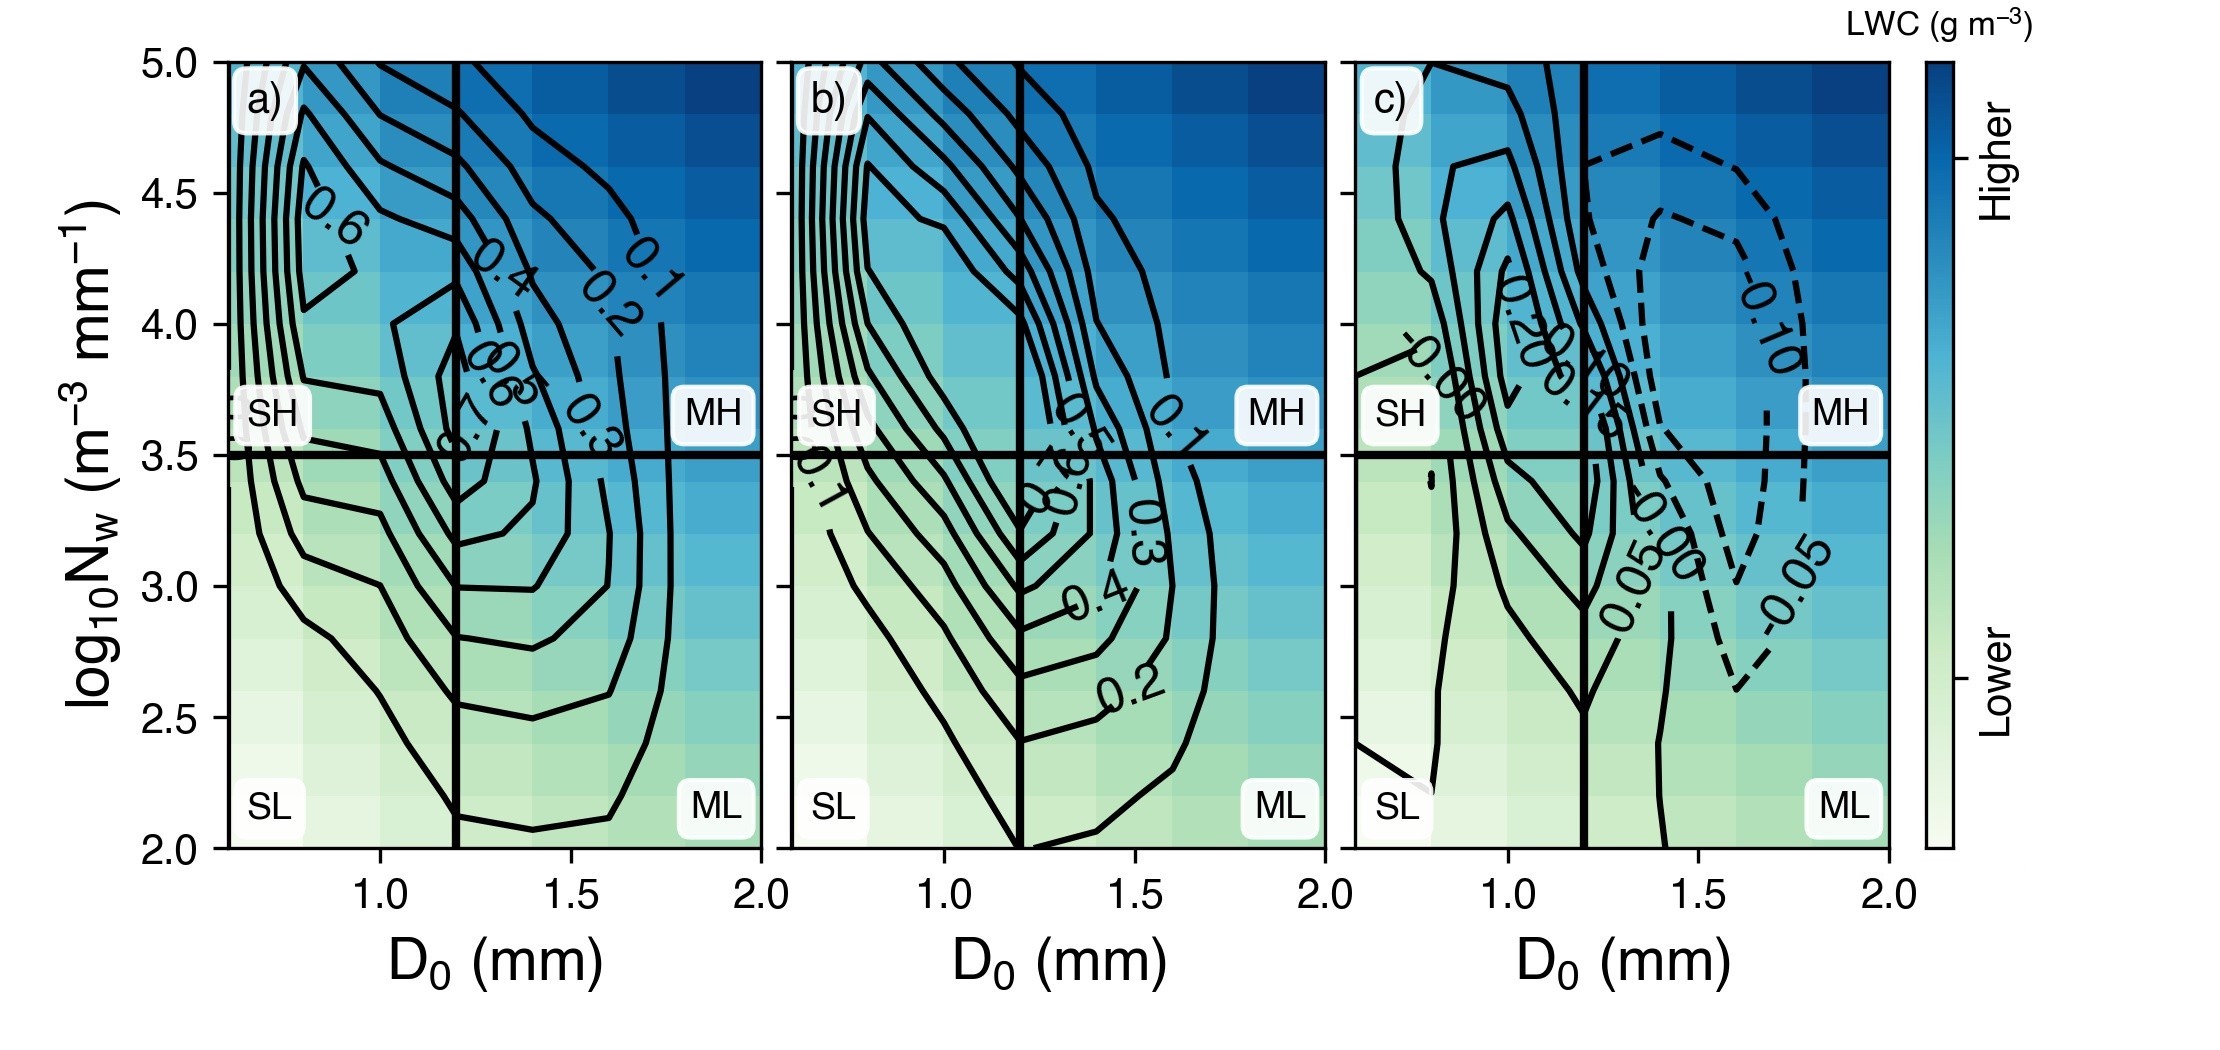
FIG. 9. a) Joint probability distribution (contours) of range-weighted $N_W$ and $D_0$ values calculated from the KHGX polarimetric data for Harvey between 0000 UTC on 26 August and 0000 UTC on 31 August. Theoretical LWC values (colors) are calculated from Equation 2. Labels indicate the different DSD quadrants (SL: low-concentration small drops, ML: low-concentration medium drops, SH: high-concentration small drops, and MH: high-concentration medium drops). b) As in a), but for data from KMHX for Florence between 0000 UTC on 13 September and 1922 UTC on 15 September, when the radar went offline and c) the difference joint probability distribution between Florence/KMHX and Harvey/KHGX (dashed contours indicate frequencies were greater for KHGX).
Acknowledgments
This study was supported by National Science Foundation awards AGS-1701225, AGS-1854607, and OAC-1661663. The authors would like to thank Dr. Ya-Chien Feng for her comments on the manuscript. The authors would also like to thank the three anonymous reviewers, whose comments helped improve this manuscript.