Camargo, S. J., J. Camp, R. L. Elsberry, P. A. Gregory, P. J. Klotzbach, C. J. Schreck III, A. H. Sobel, M. J. Ventrice, F. Vitart, Z. Wang, M. C. Wheeler, M. Yamaguchi, and R. Zhan, : Tropical cyclone prediction on sub-seasonal timescales. Tropical Cyclone Research and Review, 8, 150-165 , https://doi.org/10.6057/2019TCRR03.04
Key Points
Abstract
Here we discuss recent progress in understanding tropical cyclone (TC) subseasonal variability and its prediction. There has been a concerted effort to understand the sources of predictability at subseasonal time-scales, and this effort has continued to make progress in recent years. Besides the Madden-Julian Oscillation (MJO), other modes of variability affect TCs at these time-scales, in particular various equatorial waves. Additionally, TC activity is also modulated by extratropical processes via Rossby wave breaking. There has also been progress in the ability of models to simulate the MJO and its modulation of TC activity. Community efforts have created multi-model ensemble datasets, which have made it possible to evaluate the forecast skill of the MJO and TCs on subseasonal time-scales in multiple forecasting systems. While there is positive skill in some cases, there is strong dependence on the ensemble system considered, the basin examined, and whether the storms have extratropical influences or not. Furthermore, the definition of skill differs among studies. Forecasting centers are currently issuing subseasonal TC forecasts using various techniques (statistical, statistical-dynamical and dynamical). There is also a strong interest in the private sector for forecasts with 3-4 weeks lead time.
Key Figure
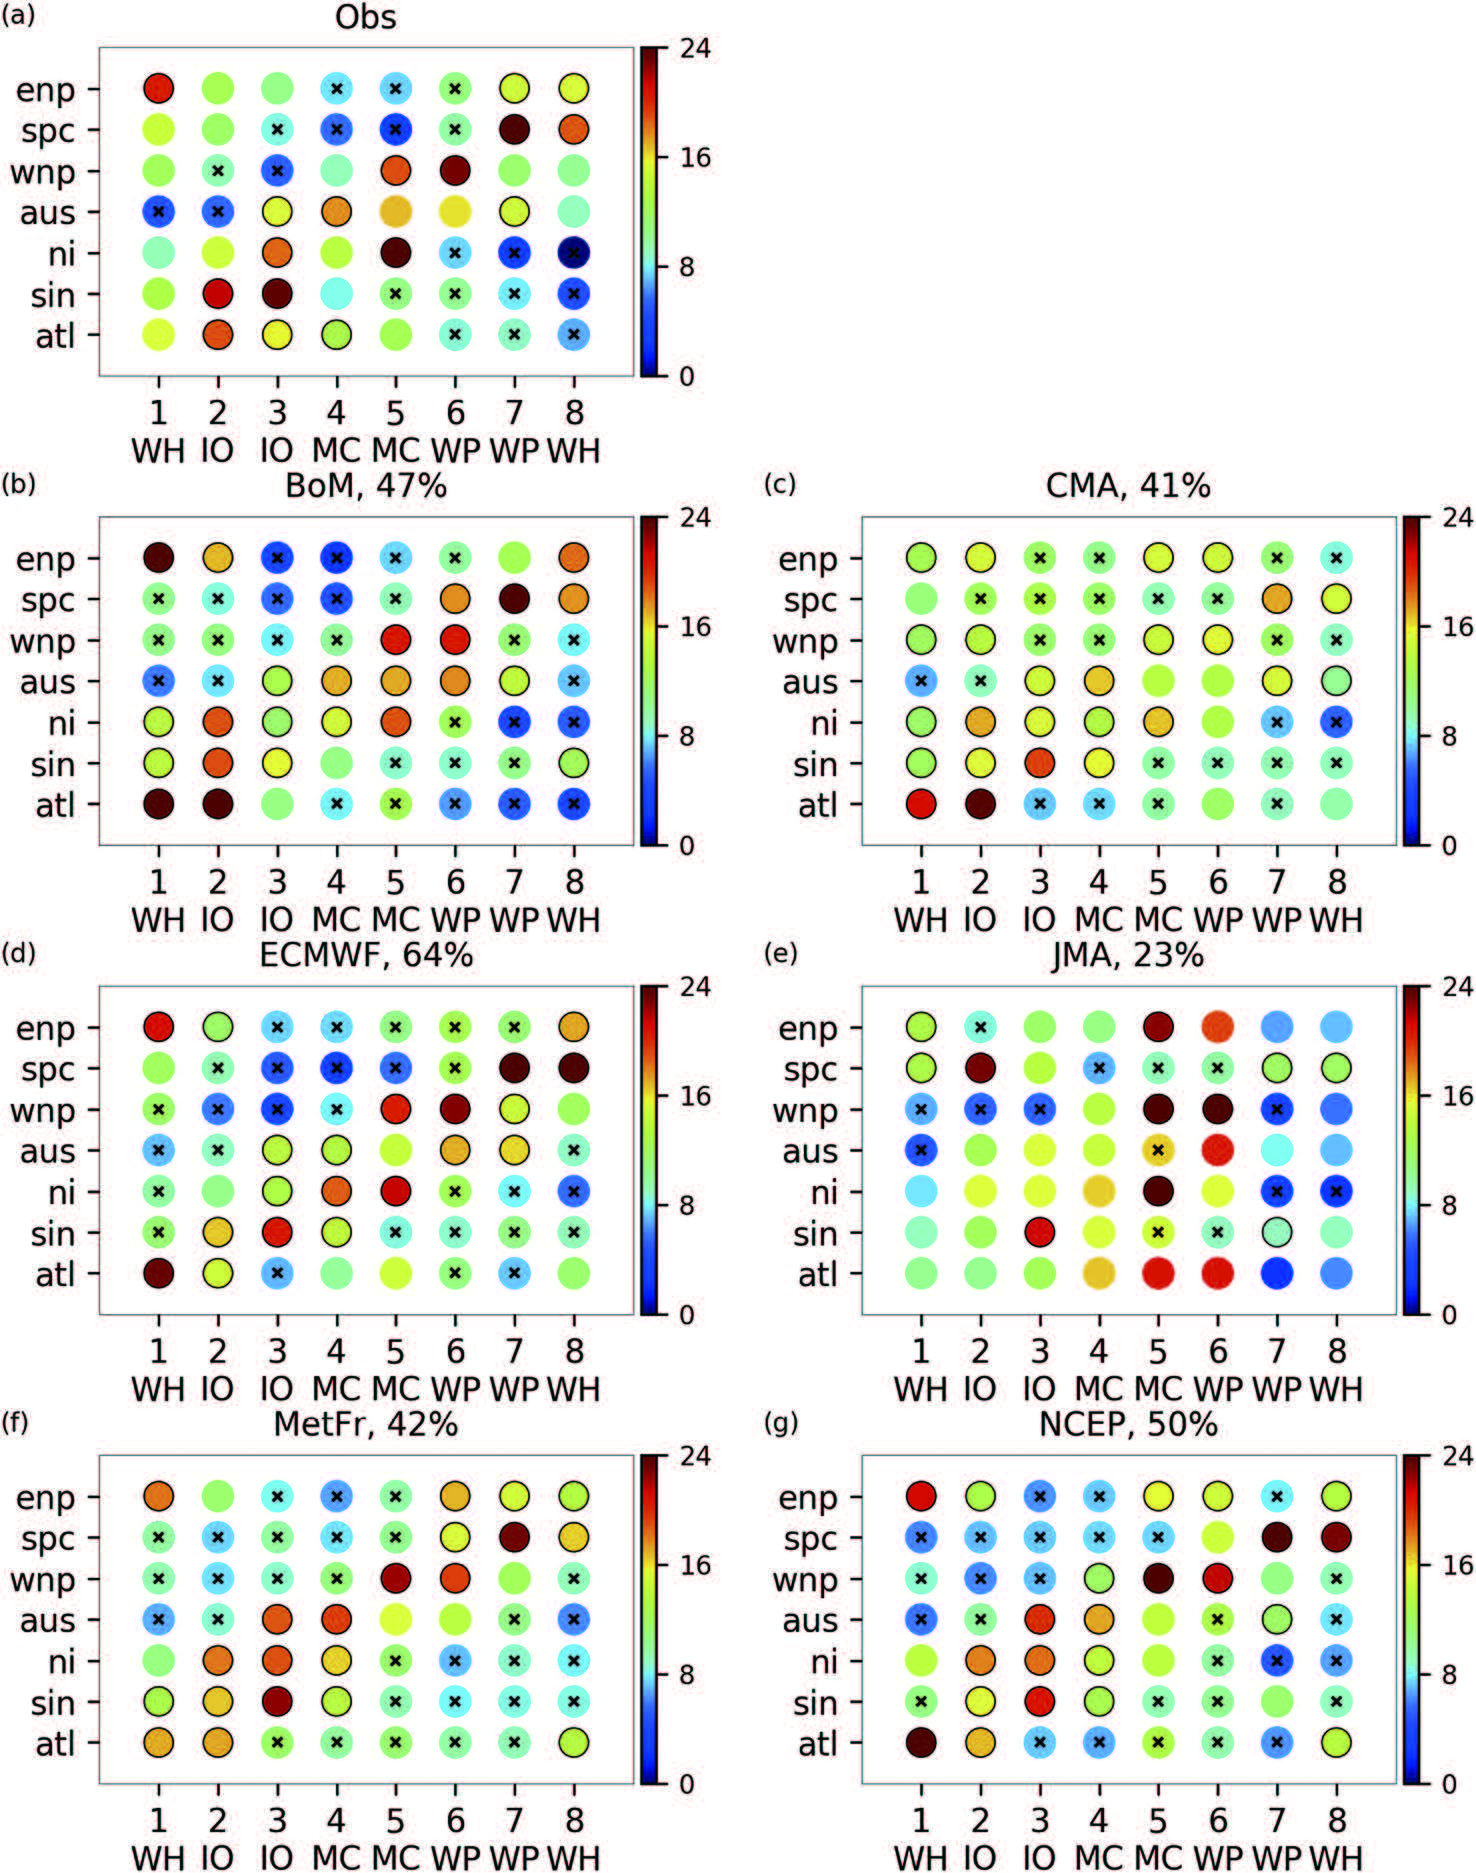
Fig. 3. Plots of the MJO–TC relationship in the observations and from the S2S models from week 2 forecasts. The color of each circle indicates the PDF (%) in the corresponding MJO phase in the basin. The sum of the circles across the MJO phases in each basin is 100%. The black circle outline indicates that the value is above the 90th percentile while the cross symbol (x) at the center means the value is below the 10th percentile. The percentage on the title corresponds to the spatial correlation of that model plot with observations (top panel). Figure from Lee et al. (2018),
Acknowledgments
SJC and AHS acknowledge support from NOAA grant NA16OAR4310079. We thank Zongjian Ke and Jianyun Gao for their contributions to the China Meteorological Administration forecast summary.