Bhardwaj. P., O. Singh, D. R. Pattaniak, and P. J. Klotzbach, : Modulation of Bay of Bengal tropical cyclone activity by the Madden-Julian oscillation. Atmospheric Research, 229, 23-38 , https://doi.org/10.1016/j.atmosres.2019.06.010
Key Points
Abstract
The influence of the Madden-Julian oscillation (MJO) on global tropical cyclone (TC) activity has been well documented in many earlier studies. However, no prior studies have focused specifically on the MJO's impacts on TCs in the Bay of Bengal (BoB). Therefore, the present study examines the impact of the MJO on BoB TC activity during the two peak TC periods i.e. April–June (AMJ) and October–December (OND) from 1974 to 2015. The MJO considerably modulates various measures of TC activity in the BoB, including the number of TCs, the number of TC days, accumulated cyclone energy, the power dissipation index, TC genesis location and TC tracks. TC activity is significantly enhanced (suppressed) over the BoB when the convectively active MJO phase is positioned over the eastern Indian Ocean and the Maritime Continent (the Western Hemisphere and Africa). Alterations in the TC genesis locations and their tracks are more pronounced in OND than in AMJ. These changes in TC characteristics are mainly attributed to MJO-driven modulations in large-scale environmental conditions such as deep convection, mid-tropospheric relative humidity, sea surface temperature, sea level pressure, lower and upper-level winds and vertical wind shear. A comprehensive knowledge of the MJO-TC relationship may be beneficial for short-term predictions of TC activity in the BoB.
Key Figure
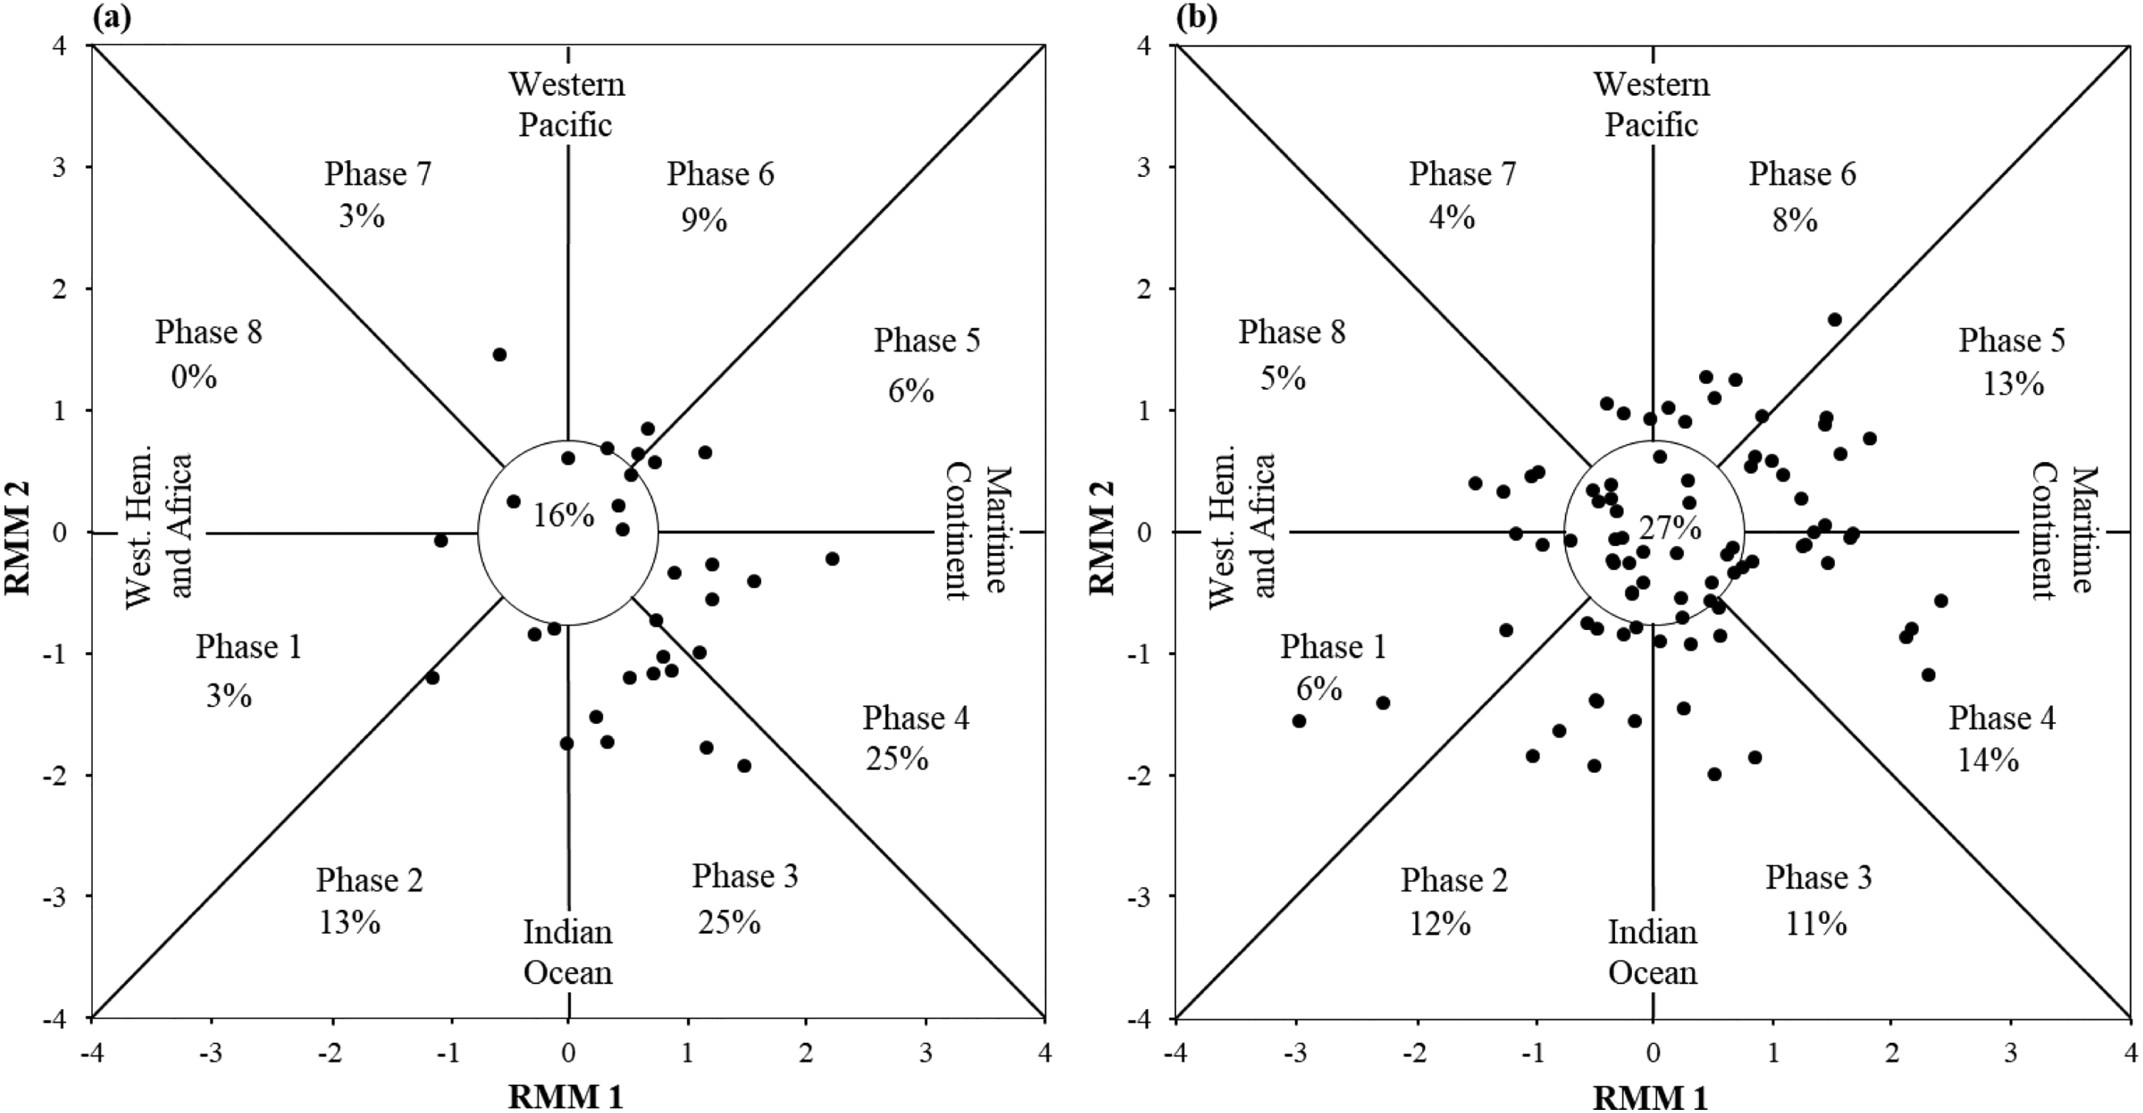
Fig. 2. The relationship between TC genesis and MJO phase during (a) AMJ and (b) OND from 1974 to 2015 (excluding 1978). The phase amplitude diagram is constructed with the principal components RMM1 and RMM2 of the MJO. The black dots represent days where TC genesis occurred. The circle in the center with an amplitude of 0.75 represents the days with weak MJO activity.
Acknowledgments
The authors thank the anonymous reviewer for critical comments and constructive suggestions which improved the overall quality of the manuscript.