Silvers, L. G. and Klotzbach, P. J. and Allen, C. J. T. and Bell, M. M. and Bowen, S. G. and Chand, S. S. and Ekström, M. and Hemmati, M. and Schreck III, C. J., : The Global Influence of ENSO on Rapid Intensification of Tropical Cyclones. Geophysical Research Letters, 52, e2025GL115334 , https://doi.org/10.1029/2025GL115334
Key Points
Plain Language Summary
Abstract
Abstract Tropical cyclone (TC) rapid intensification (RI) is a major source of uncertainty in TC prediction. Here we examine observed basin-specific relationships between RI and El Niño-Southern Oscillation (ENSO), where RI is defined as a TC strengthening by ≥30 kt within 24 hr. During El Niño, the number of RI events significantly increases in the eastern North Pacific, western North Pacific and South Pacific, with the opposite behavior in the North Atlantic. During La Niña, changes in RI occurrence in the Atlantic and Pacific are approximately opposite as in El Niño. The ENSO–Indian Ocean RI relationship is weak. These changes are consistent with environmental conditions modulating RI, including mid-level moisture, vertical wind shear, sea surface temperatures and potential intensity. Because of disagreement between the recently observed La Nina-like trend and an El Niño-like trend simulated by climate models, improved model representation of ENSO could reduce future uncertainty in RI projections.
Key Figure
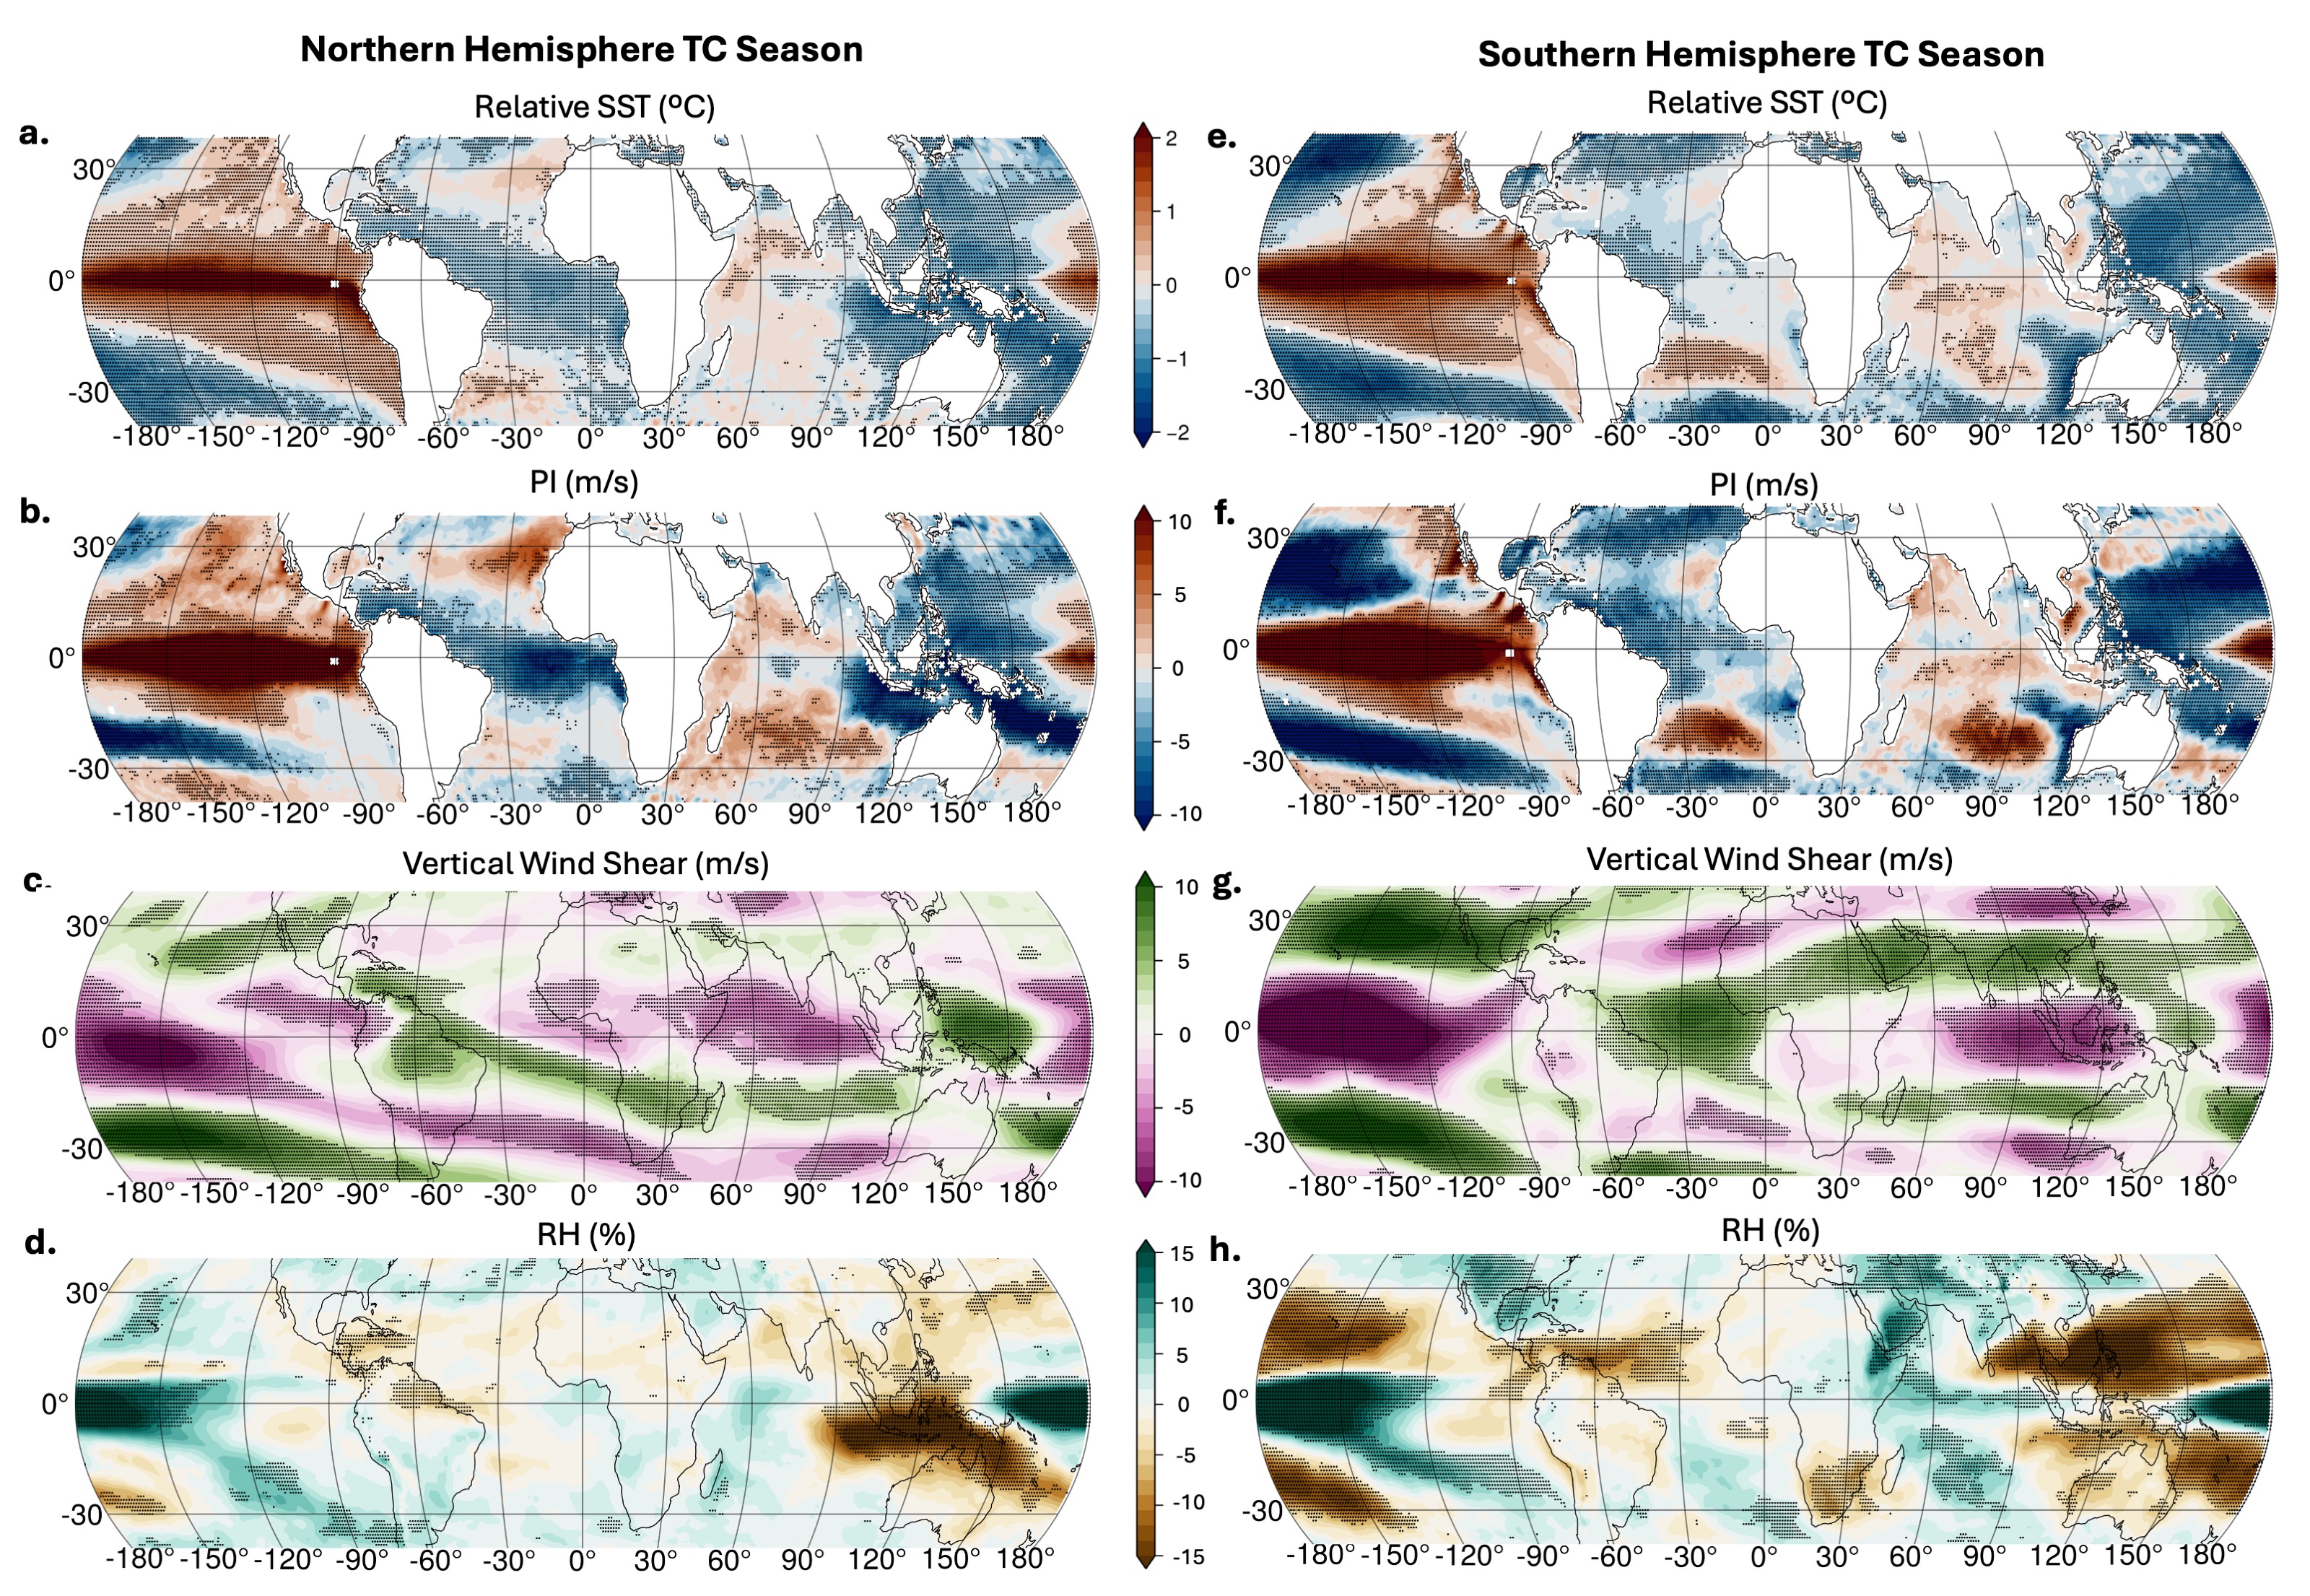
Large‐scale composite environmental conditions (El Niño years minus La Niña years). The left column (a–d) shows the Northern Hemisphere TC season (June–November),whiletherightcolumn(e–h)showstheSouthernHemisphereTCseason(November–April).(a,e)rSSTdifference(°C),(b,f)PIdifference(ms− 1), (c,g)200–850‐hPaverticalwindsheardifference(ms− 1),and(d,h)700hPaRHdifference(%).Blackcirclesindicategridpointswithstatisticalsignificanceatthe0.05 level after controlling for the false discovery rate (Wilks, 2016).
Acknowledgments
LGS, PK, MMB and SC acknowledge funding from Gallagher Re through the Gallagher Research Centre Global Tropical Cyclone Consortium. LGS, PK, and MMB also acknowledge funding from the Office of Naval Research award N00014‐20‐1‐2069 and the G. Unger Vetlesen Foundation. LGS acknowledges funding from the National Science Foundation award 2327958. We would like to thank Hamish Ramsay, an anonymous reviewer and the editor, Suzana Camargo, for helpful comments that have substantially improved the quality of this manuscript.